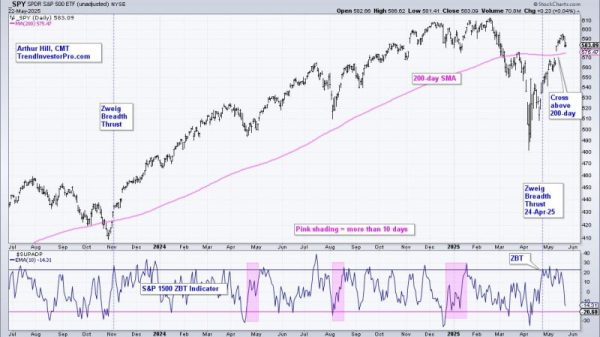


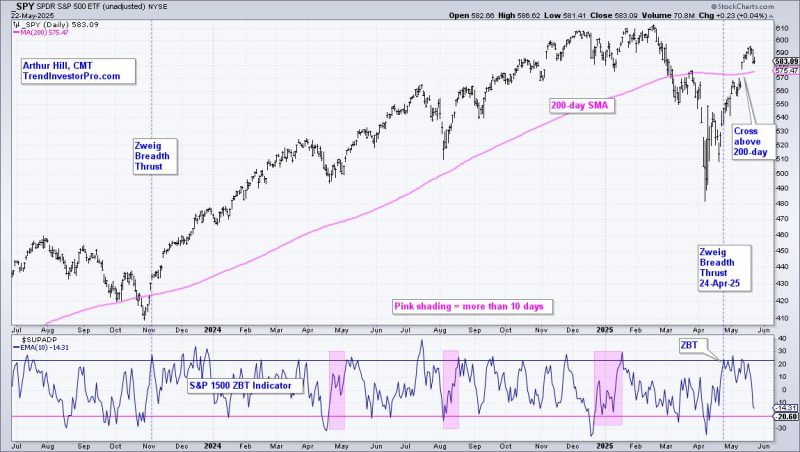
The bullish signals stacked up in April and May, but most long-term breadth indicators are still bearish. SPY and QQQ showed signs of capitulation in early April and rebounded into mid April. A Zweig Breadth Thrust triggered on April 24th and several other thrust indicators turned bullish in May. We also saw SPY and QQQ break their 200-day SMAs. TrendInvestorPro is tracking these signals and relevant exit strategies.
These are bullish indications for large-caps and, perhaps, stocks in the top half of the S&P 500. However, I would not call it a bull market until participation broadens. The chart below shows the S&P 500 EW ETF (RSP) and S&P MidCap 400 SPDR (MDY) moving back below their 200-day SMAs. The S&P SmallCap 600 SPDR (IJR) never came close and remains a big laggard.
The bottom window is perhaps the most telling. It shows the percentage of S&P 1500 stocks above their 200-day SMAs. This long-term breadth indicator did not cross above 50% in May. Except for a 1-day dip on January 10th, this indicator was above 50% from December 2023 to February 2025 (bull market). It broke below 40% on March 10th and has yet to fully recover (bear market).
At the very least, a move above 50% is needed to show broadening participation worth of a bull market. This is how the market moves from bullish thrust signals to a bull market. Until such a move, we are still in bear market mode and risk remains above average for stocks. Note that the S&P 1500 includes large-caps (500), small-caps (600) and mid-caps (400). Around 2/3 of components NYSE stocks and 1/3 Nasdaq stocks. It is a truly representative of the broader market.
Exit strategies are just as important as entries. The Zweig Breadth Thrust and the 5/200 day SMA cross provided entry signals in April and May. We now need an exit strategy. TrendInvestorPro put forth exit strategies for both signals and these are updated in our reports. This week we covered the gap zones in SPY and QQQ, long-term breadth signals, big moves in metals and continued strength in Bitcoin. Click here to take a trial and gain full access.
////////////////////////////////////////////