


S&P 500 and Nasdaq fall on Tuesday under bearish pressure
- On Tuesday, the S&P 500 retreated from an all-time high down to the weekly open level in the 5800.0 zone
- On Tuesday in the US session, the Nasdaq was under a lot of pressure, which resulted in a bearish impulse from 20495.0 down to the $20087 level
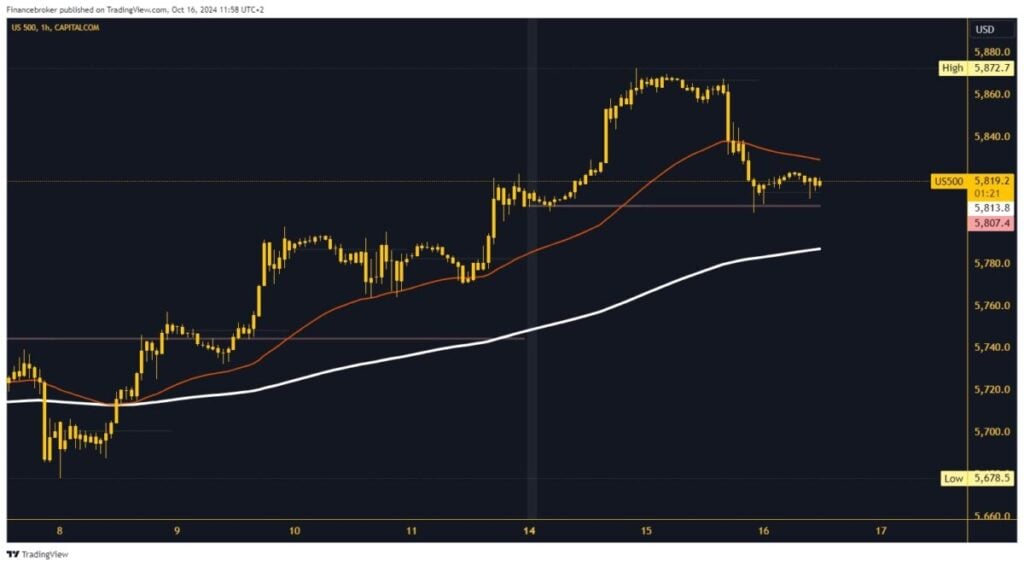
S&P 500 chart analysis
On Tuesday, the S&P 500 retreated from an all-time high down to the weekly open level in the 5800.0 zone. During this morning’s Asian trading session, the index moved in the 5810.0-5825.0 range. In the EU session, we continue in the same direction without any major volatility. We are holding above the weekly open level, while on the upper side, we have resistance in the EMA 50 moving average. We are getting closer to the beginning of the US session and expect an increase in market volatility.
With the momentum above the EMA 50 moving average, there is room for bullish consolidation. Potential higher targets are 5840.0 and 5860.0 levels. For a bearish option, the S&P 500 would have to break below the weekly open level. Thus, we move to a new low and confirm the bearish pressure on the index. Potential lower targets are 5780.0 and 5760.0 levels. Additional support and the first obstacle to further decline are the EMA 200 and the 5780.0 zone.
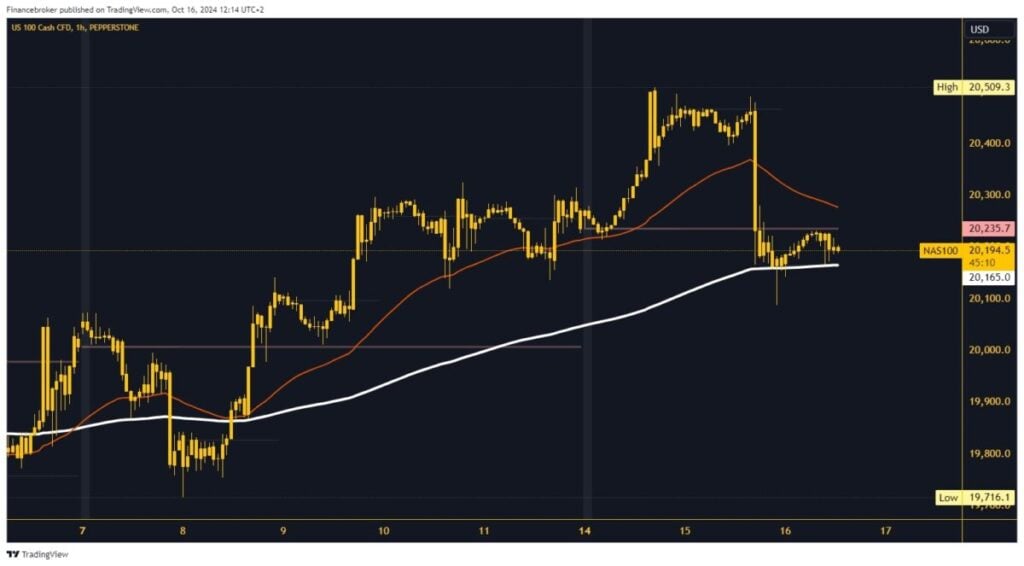
Nasdaq chart analysis
On Tuesday in the US session, the Nasdaq was under a lot of pressure, which resulted in a bearish impulse from 20495.0 down to the $20087 level. Below, we encountered the EMA 200 moving average, which stopped further decline and took us back to the 20160.0 level. During this morning’s Asian trading session, the movement of the Nasdaq was in the 20160.0-20230.0 range. We need a new impulse to return to the positive side above the weekly open level.
If the index succeeds in this, it will be in a better position to initiate a bullish consolidation. Potential higher targets are 20300.0 and 20400.0 levels. For a bearish option, we need a negative consolidation below the EMA 200 moving average and the 20150.0 level. With this step, we increase the momentum to continue to the bearish side. After that, it remains for the Nasdaq to start pulling back and look for a new support level. Potential lower targets are 20100.0 and 20000.0 levels.
The post S&P 500 and Nasdaq fall on Tuesday under bearish pressure appeared first on FinanceBrokerage.